Part 1:Project Covid-19 Report

Project-In-Charge Leaders:
Heshani Wijetunga (Brazil, France, China and Sri Lanka)
&
Inesh Palihapitiya (Sri Lanka, Australia and New Zealand)
Members:
1. Dulakshana Y.Sh. (Japan and Sri Lanka)
2. Sasirindu Bandara (USA)
3. Ama Perera (Italy)
4. Luqman Firoz (Germany)
5. Ryan Kularathne (Iceland)
6. Tharuki Dissanayake (Spain)
7. Yuthin Himsara (UK)
Contents
•Introduction
•Country analysis
Introduction
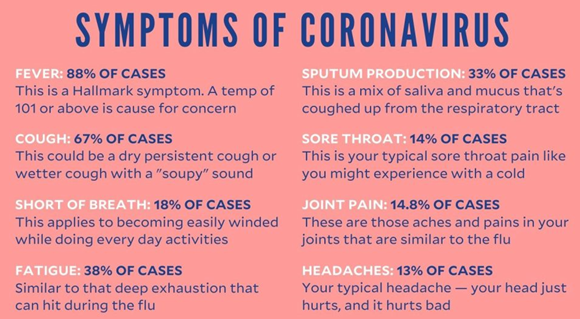
A novel coronavirus (COVID-19) was identified in 2019 in Wuhan, China. Coronaviruses are single-stranded RNA viruses, about 120 nanometers in diameter. They are susceptible to mutation and recombination and are therefore highly diverse. Mathematical models have played an important role in the ongoing crisis; they have been used to inform public policies and have been instrumental in many of the social distancing measures that were instituted worldwide.
Mathematical modelling performs a vital part in estimating and controlling the recent outbreak of coronavirus disease 2019 (COVID-19). Mathematical models are efficient tools to understand the ongoing trends for COVID-19. One of the most significant problems during the pandemic is whether we can develop mathematical models to predict the evolution of the epidemic, and estimate the effectiveness of various intervention measures and their impact on the economy. Coronavirus disease 2019 (COVID-19) pandemic is vastly spreading worldwide, with more than 7.4 million confirmed cases and 418,294 deaths (5.64% mortality rate) on 12 June 2020 (WHO, 2020). Because this pandemic is unprecedented, models to predict the outbreak are scarce, mathematically complex or not available.
The ongoing COVID-19 pandemic is the most significant pandemic since the 1918 Influenza pandemic. Different age groups normally have varying degrees of contact and have changed their behaviour differently during the COVID-19 pandemic; e.g., young people seem to get milder infections.
Before an epidemic, models are used for planning and identifying critical gaps and preparing plans to detect and respond in the event of a pandemic.
At the start of a pandemic, policymakers are interested in asking questions such as:
(i) Where and how did the pandemic start?
(ii) Risk of its spread in the region?
(iii) Risk of importation in other regions of the world?
(iv) Basic understanding of the pathogen and its epidemiological characteristics?
As the pandemic takes hold, researchers begin investigating:
(i) various intervention and control strategies; usually pharmaceutical interventions do not work in the event of a pandemic and thus non-pharmaceutical interventions are most appropriate
(ii) forecasting the epidemic incidence rate, hospitalization rate and mortality rate
(iii) efficiently allocating scarce medical resources to treat the patients
(iv) understanding the change in individual and collective behaviour and adherence to public policies.
After the pandemic starts to slow down, modellers are interested in developing models related to recovery and the long-term impacts caused by the pandemic.
As in other pandemics, researchers and public health policymakers are interested in questions such as,
(i) How did it start?
(ii) How is it likely to progress and how can we control it?
(iii) How can we intervene while balancing public health and economic impact?
(iv) Why did some countries do better than other countries thus far into the pandemic?
In particular, models and their projections/forecasts have received unprecedented attention. Sometimes, with a multitude of modelling frameworks, underlying assumptions, available datasets and the region/timeframe being modelled, these projections have varied widely, causing confusion among end-users and consumers.
Country Reports
USA
The World Health Organization declared COVID-19 as a pandemic on 11th March 2021. The USA is presently the country with the highest number of positive COVID-19 cases and the highest number of deaths because of the virus. The objective of this study was to develop a mathematical model to predict the epidemic in the USA utilizing the concepts of statistical analysis.
How did the pandemic start to spread?
On January 20th, the first case of COVID-19 was reported in Washington, a 35-year-old man who returned from Wuhan, China on the 15th. On January 31, The Trump administration suspended entry into the United States by any foreign nationals who had travelled to China in the past 14 days, excluding the immediate family members of American citizens or permanent residents. By this date, 213 people had died and nearly 9,800 had been infected worldwide.
On February 29, the authorities announced that a patient near Seattle had died from the coronavirus, in what was believed to be the first coronavirus death in the United States at the time. However, Officials in Santa Clara County, Calif, announced that two residents there died of the coronavirus on Feb. 6 and Feb. 17, making them the earliest known victims of the pandemic in the United States yet it came to light on April 21.
The Centers for Disease Control and Prevention advised safety precautions such as no gatherings of 50 or more people in the United States over the next eight weeks. The recommendation included weddings, festivals, parades, concerts, sporting events and conferences. New York City’s public schools system, the nation’s largest with 1.1 million students, announced that it would close.
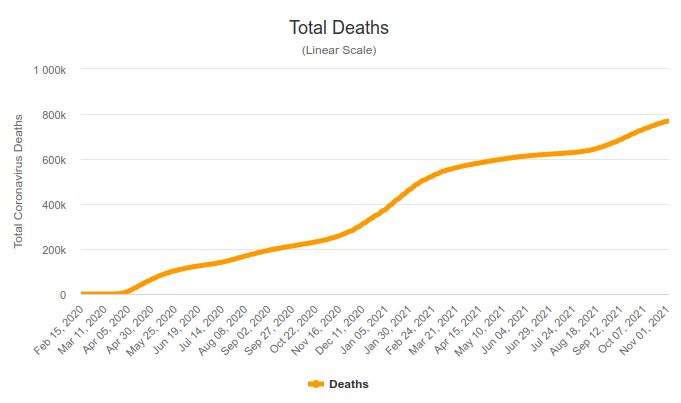
The United States officially became the country hardest hit by the pandemic by March 26, with at least 81,321 confirmed infections and more than 1,000 deaths. This was more reported than in China, Italy or any other country at the time. Four months after the government confirmed the first known case, more than 100,000 people who had the coronavirus were recorded dead in the United States. The death toll was far higher than in any other nation around the world.
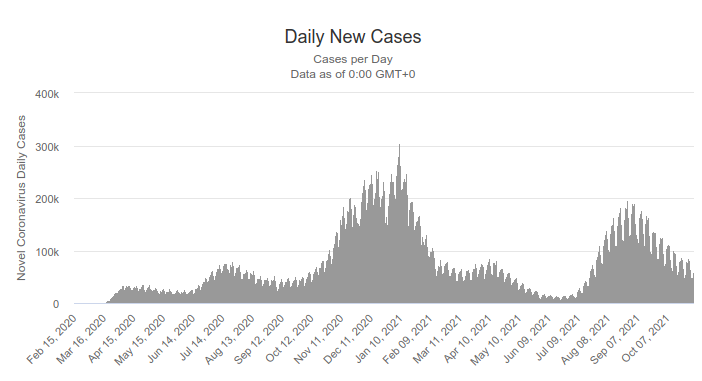
How has it varied over time?
On June 20, for the third straight day, Florida and South Carolina broke their single-day records for new cases. The news came as infection levels for Missouri and Nevada also reached new highs. On June 19, the United States reported more than 30,000 new infections, its highest since May 1, with cases rising in 19 states across the South, West and Midwest.
On July 10, the United States reached 68,000 new cases for the first time including at least six states that had also reported single-day records for new cases: Georgia, Utah, Montana, North Carolina, Iowa and Ohio. According to a study, 5.4 million Americans lost their health insurance because of the virus between February and May.
The United States recorded more than 1.9 million new infections in July, nearly 42 per cent of the more than 4.5 million cases reported nationwide since the pandemic began and more than double the number documented in any other month, according to data compiled by The New York Times.
Amidst that on August 16, the C.D.C. began consulting with California, Florida, Minnesota and North Dakota as well as Philadelphia to develop plans for distributing a coronavirus vaccine and was the largest such campaign ever undertaken by the U.S government.
More than 51,000 cases of the coronavirus had been identified at American colleges and universities throughout the pandemic by September 3. The New York Times surveyed more than 1,500 colleges and found that over two-thirds had reported at least one case. New York City later reopened all its public schools on October 1 but a quarter of a million coronavirus infections were reported at colleges and universities across the United States on November 5. By September 22, the death toll in the United States from the coronavirus pandemic passed 200,000 which was more than any other country.
The U.S. surpassed 10 million infections on November 8 and by the 18th of the same month reached 250,000 coronavirus-related deaths as the country struggled to contain outbreaks in the third and most widespread wave of infection since the pandemic began. That number was expected to sharply increase as infections surged nationwide, particularly in the Midwest and Mountain States. On December 2, the United States became the first Western country to allow mass inoculations of the Pfizer vaccine but by December 14 the U.S. death toll surpassed 300,000. As of January 12, there are 22.7M COVID-19 cases and 381K deaths in the US.
Arriving at an interpretation using metrics
Finding positive rate;
Total number of tests: 703,435,530
Total number of confirmed cases: 46,999,771
Positive rate = (46,999,771/703,435,530)*100 = 6.68 (3 s.f) As of 2/11/2021
According to criteria published by WHO in May, a positive rate of more than 5% is one indicator that the epidemic is not under control in a country.
Tests per confirmed case= 703,435,530/46,999,771 = 15 (nearest integer)
WHO has suggested around 10 – 30 tests per confirmed case as a general benchmark of adequate testing.
Number of COVID-19 patients per km²;
Number of confirmed cases – 47 million
Area of USA – 9.834 million km²
Number of cases per km² =47million/9.834 million km² = 4.8 (2sf)
From these results, it can be concluded that the USA is doing fairly enough testing, currently. In countries with a high positive rate, the number of confirmed cases is likely to represent only a small fraction of the true number of infections. In conclusion, the USA still provides a considerable number of COVID-19 cases.
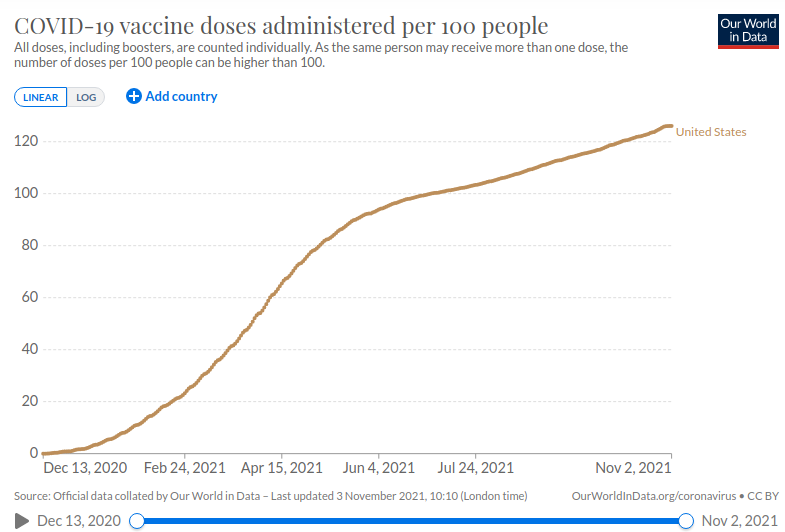
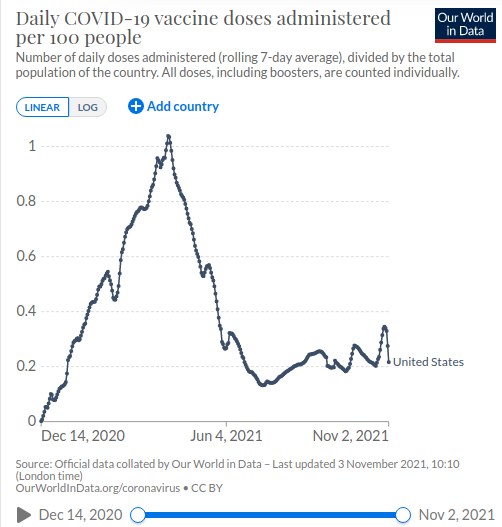
Vaccination
The COVID-19 vaccination campaign in the United States began in December 2020. As of 2nd November 2021, about 57% of the population is fully vaccinated against COVID 19.
The following are vaccines approved by FDA and recommended by CDC for use in the US for a limited population
BioNTech, Pfizer vaccine
Johnson & Johnson vaccine
Moderna, NIAID vaccine
The following charts provide an idea of the progress of the vaccination campaign in the US.
Resources
https://www.nytimes.com/article/coronavirus-timeline.html
https://www.nejm.org/doi/full/10.1056/NEJMoa2001191
https://www.worldometers.info/coronavirus/country/us/
https://www.bbc.com/news/world-us-canada-55305720
https://www.cdc.gov/coronavirus/2019-ncov/vaccines/index.html
https://ourworldindata.org/covid-vaccinations

Italy
The Covid-19 pandemic in Italy is caused by severe acute respiratory syndrome coronavirus (SARS-Cov-2). The virus was first confirmed to have spread to Italy on the 31st of January 2020, when two Chinese tourists in Rome were tested positive.
How did the pandemic start to spread and how did it vary over time?
One week later, an Italian man repatriated back to Italy from the city of Wuhan, China was hospitalised and confirmed as the third case in Italy. Clusters of cases were later detected in 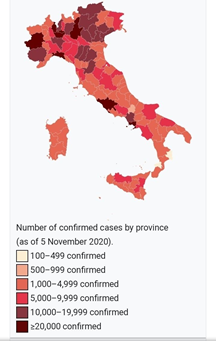 Lombardy and Veneto on 21st February. By the beginning of March, the virus had spread to all the regions of Italy. As of the 11th of January 2021, Italy had 575,979 active cases, one of the highest in the world. Overall, there have been 2,289,021 confirmed cases and 79,203 deaths while there have been 1,633,839 recoveries or dismissals. By 11th January, Italy had tested about 15,465,000 people.
The actions taken by the Italian government against covid-19
On 31st January 2020, the Italian government suspended all flights to and from China and declared a state of emergency. In February, eleven municipalities in northern Italy were identified as centres of two main Italian clusters and placed under quarantine. On 8th March 2020, Prime Minister Giuseppe Conte expanded the quarantine to all of Lombardy and 14 other northern provinces. On 21st March, the Italian government closed all non-residential businesses and industries and restricted the movement of people. Eventually, in May, many restrictions were gradually eased and finally on 3rd June, the freedom of movement across regions were restored.
Statistical Analysis of Italian Covid-19 Data
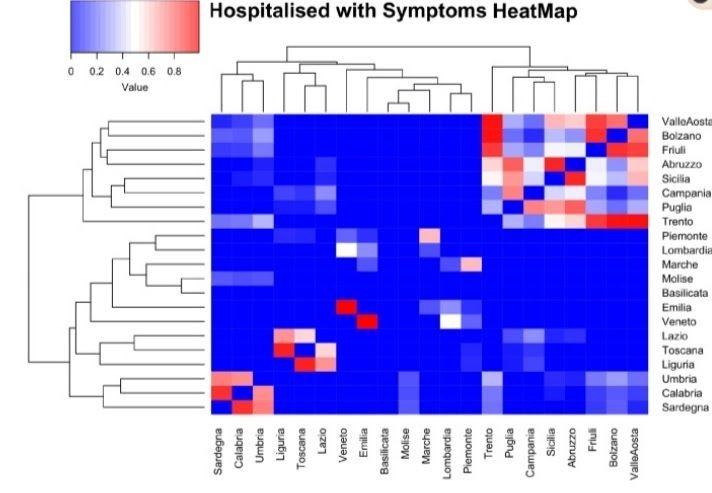
Many techniques were used to analyse and evaluate the Italian Covid-19 data. The study on daily analysis aims to provide a graph-based representation of daily data provided by Italian Civil Protection that enables evaluation of which regions show similar behaviour and discovery of communities.
An Analysis Pipeline was designed to model Italian Covid-19 data to investigate similarity among Italian regions with respect to data provided by Italian Civil Protection and to identify clusters of regions with similar behaviour.
This model includes the following steps,
● Building of similarity matrix
The similarity among a pair of regions is computed by applying a statistical test called Wilcoxon Sum Rank Test where the (i,j) value of matrix for data k represents the p-value of Wilcoxon statistical test obtained by performing the test on swag measures the region i with respect to region j. If the p-value is higher then the regions are more similar with respect to that measure and vice versa.
 This is a Wilcoxon Sum Rank Test
● Mapping similarity matrices to networks
● Temporal analysis of network (helps in the building of the network at different time intervals)
● Community detection
Other mathematical concepts used, Wilcoxon Sum Rank Test is a nonparametric test designed to evaluate the difference between two treatments or conditions where samples are correlated.
Due to the evolution of the Covid -19 outbreak, the scientific community is making effort to analyse models for understanding present situations and predicting future scenarios by monitoring Italian Covid-19 spread using the Forced SEIRD model(Susceptible, Exposed, Infected, Recovered and Dead) which is flexible and can be quickly adapted to monitor various epidermic scenarios. Also, a logistic model is used which describes an infection growth that is going to stop in future. 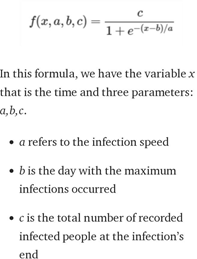
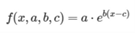
Most generic expression of the logistic function,
Also, there is an Exponential model which describes unstoppable infection growth. 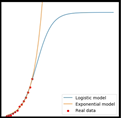
Real data-driven modelling is an effort to help evaluate and curb the spread of the novel virus. Most importantly lockdowns and the effectiveness of reduction in the contacts in Italy has been measured via this model.
From all these results, it can be concluded that Italy is still in the progress of defeating Coronavirus with the help of many mathematical epidemiological models of Covid-19 to investigate the dynamics of this pandemic disease.
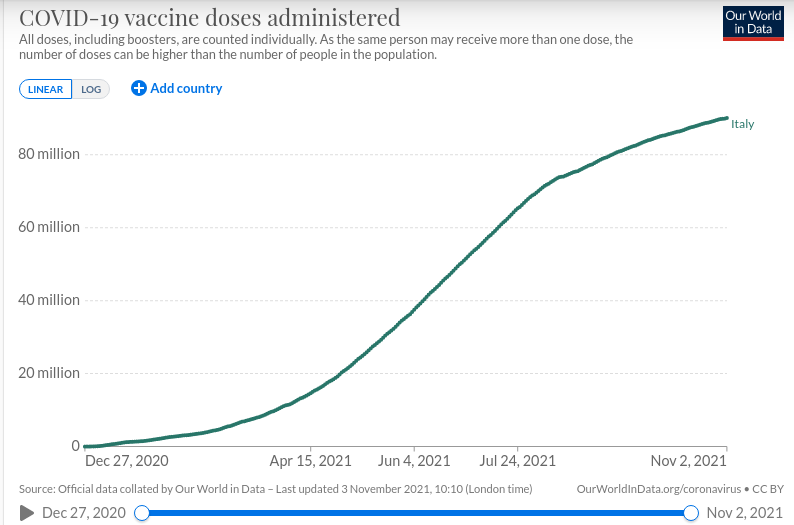
Vaccination
COVID 19 vaccination campaign began in late December. As of 2nd November, about 71.6% of the population is fully vaccinated against the virus while 5.7% is only partly vaccinated. These drugs are being used as vaccines for COVID 19.
- BioNTech, Pfizer vaccine
- Johnson & Johnson vaccine
- Moderna vaccine
- Oxford, AstraZeneca vaccine
The following charts give an idea of the progress of the COVID 19 campaign of Italy. 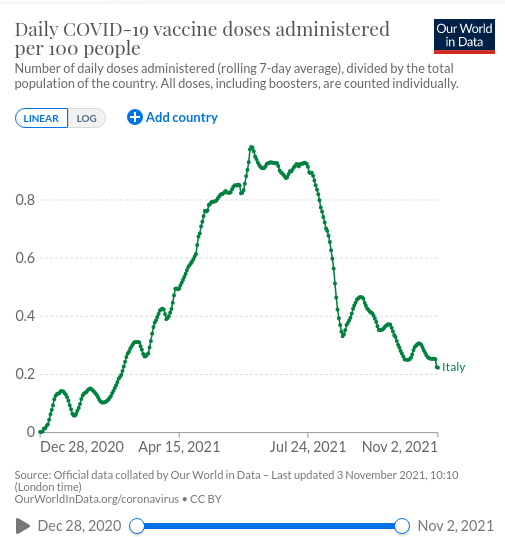
Resources
https://www.aifa.gov.it/en/vaccini-covid-19
https://www.worldometers.info/coronavirus/country/italy/
https://ourworldindata.org/covid-vaccinations
Brazil

In Brazil, the COVID-19 pandemic started on 26 February 2020, and rapidly spread into the country, starting in Sao Paulo and Rio de Janeiro states and disseminating to other Brazilian states a few weeks later. Three months after the first COVID-19 case, several Brazilian states already are in critical condition, with their health systems overloaded, most of them above 80% occupancy or even collapsing. Nowadays, Brazil is considered the epidemic centre of Latin America, occupying second place in the total number of cases and more recently in the total number of deaths.
While no specific vaccine or treatment against COVID-19 is available, the best strategy to combat the disease is preventive measures and social distancing. The Brazilian government is making important decisions to avoid the Sars-CoV-2 spread. Different mechanisms and levels of social distancing have been imposed, including 1.5 meters of distance among people (in lines, public spaces, and transportation), quarantine, and lastly, lockdown. Most Brazilian cities adopted quarantine with only essential services allowed to work. In some critical cities, a lockdown was imposed. Other preventive measures include sanitation (hands, personal objects, and public spaces), face mask usage, complete isolation of infected people, and flu vaccination. To be able to properly monitor the spread of the virus, countries with more widespread outbreaks need to do more testing.
The COVID-19 pandemic in Brazil showed a completely different pattern. It was predicted that the peak of daily new cases would be in early May 2020 and then the number should decline based on the math modelling. However, the daily new cases kept increasing at least to the end of June 2020, so that the daily new cases and the accumulated cases diverged significantly from the predicted curves. By 30 June 2020, the total number of accumulated cases in Brazil was 1.865 million, a stunning 10.4 times more cases than the predicted 0.179 million.
Most countries and states in the current analysis, although some reluctantly, took the same immediate responses as described above so a common pattern of peak point and subsequent decrease of new cases was observed. The unusual case in Brazil strongly indicated another scenario in which not even the basic immediate responses were taken, which allowed the virus to continue infecting large numbers of people who otherwise would be protected. In this case, the natural viral dynamic is disrupted, and no math model will be effective in predicting the next phase of transmission.
Economic recovery put to a halt – The COVID-19 pandemic has, unsurprisingly, also affected Brazil’s economy and projections of growth.
Additional pressure on a strained health system
As in other nations across the globe, the coronavirus represents a major challenge to the overall health system in Brazil. The country’s health security index indicates a relatively high capacity to promptly address an epidemic. Yet, in March 2020, more than one-third of Brazilians believed the country was not prepared to fight the COVID-19 outbreak.
In fact, there were approximately 6.7 thousand hospitals in Brazil in 2019, 200 less than in 2010. Meanwhile, the rate of hospital beds in the country consistently decreased over the past decade. The COVID-19 pandemic adds extra pressure on a society that had already been struggling to provide appropriate healthcare for its residents.
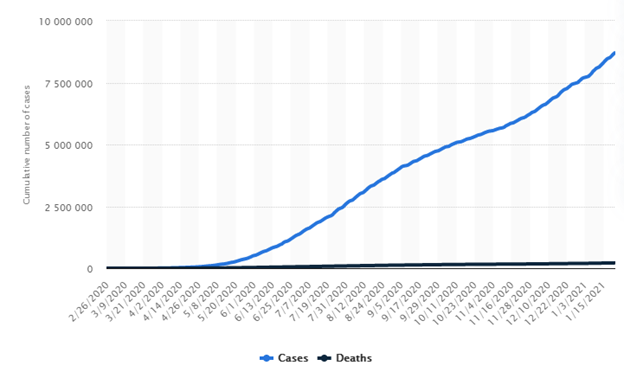
Brazil: COVID-19 cases and deaths 2020-2021
The COVID-19 disease was detected in Brazil on February 26, 2020, making it the first Latin American country to report a case of the novel coronavirus. Since then, the number of infections has risen drastically, reaching almost 8.7 million cases by January 22. Meanwhile, the first death due to this disease in Brazil was reported on March 18, 2020. Ten months later, the number of fatal cases surpassed 214 thousand.
Number of confirmed cases and deaths of coronavirus (COVID-19) in Brazil from February 26th, 2020 to January 22, 2021
COVID-19 testing data
Finding positive rate;
Total number of PCR tests: 28,600,000
Total number of confirmed cases: 8,699,814 ![]()
Positive rate = = 30.4% (3 s.f)

Tests per confirmed case = = 3 (nearest integer)
Vaccination
The COVID-19 vaccination campaign in Brazil is an ongoing mass immunization campaign for the COVID-19 pandemic in Brazil. It started on January 17, 2021, when the country had 210 thousand deaths.
- BioNTech, Pfizer vaccine
- CoronaVac vaccine
- Johnson & Johnson vaccine
- Oxford, AstraZeneca vaccine
- Sputnik V vaccine
REFERENCES
https://www.statista.com/topics/6168/coronavirus-covid-19-in-brazil/#dossierSummarychapter1
https://www.worldometers.info/coronavirus/#countries
France

Like much of the rest of Europe, France has been badly affected by the outbreak; it introduced lockdown measures on March 17 intending to significantly reduce the circulation of the virus among the population.
To help understand and manage this unprecedented health situation, it is vital to be able to estimate the level of circulation of the virus among the population, to evaluate the risk of developing a severe form of the disease and to identify indicators that measure the impact of the steps currently being taken against the outbreak.
The COVID-19 pandemic is taking a heavy toll on many European countries, and France is no exception, with more than 26,000 deaths as of May 11th, 2020. On March 17, the French government imposed a nationwide lockdown in a bid to stop the virus from spreading and prevent intensive care units from being overwhelmed. 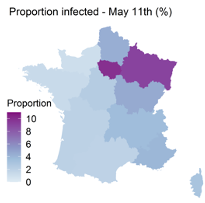
Developing a lockdown exit strategy involves evaluating the impact of this unprecedented measure on the transmission of the SARS-CoV-2 virus and improving our understanding of the risk that infected individuals will develop a severe form. Estimate of the percentage, by region in France, of people infected with SARS-CoV-2, by May 11, 2020.
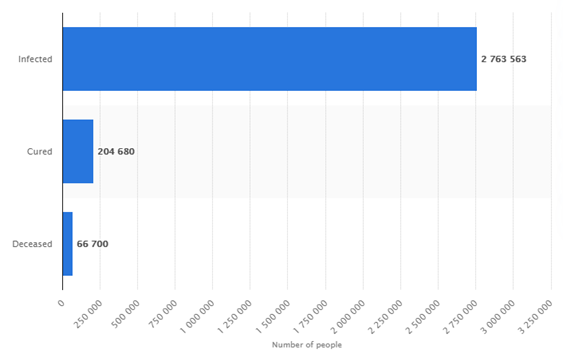
Number of people infected, deceased and cured of the coronavirus (COVID-19) in France as of January 7, 2021
COVID-19 testing data
Finding positive rate;
Total number of PCR tests: 40,885,502
Total number of confirmed cases: 2,987,965 ![]()
Positive rate = = 7.31% (3 s.f)

Tests per confirmed case = = 14 (nearest integer)
Total Recovered = 214,538
Total deaths = 71,998
Vaccinations
COVID-19 vaccination in France started on 27 December 2020 after the approval of the Pfizer/BioNTech vaccine by the European Union commission.
- BioNTech, Pfizer vaccine
- Johnson & Johnson vaccine
- Moderna vaccine
- Oxford, AstraZeneca vaccine
REFERENCES
https://www.worldometers.info/coronavirus/#countries
United Kingdom

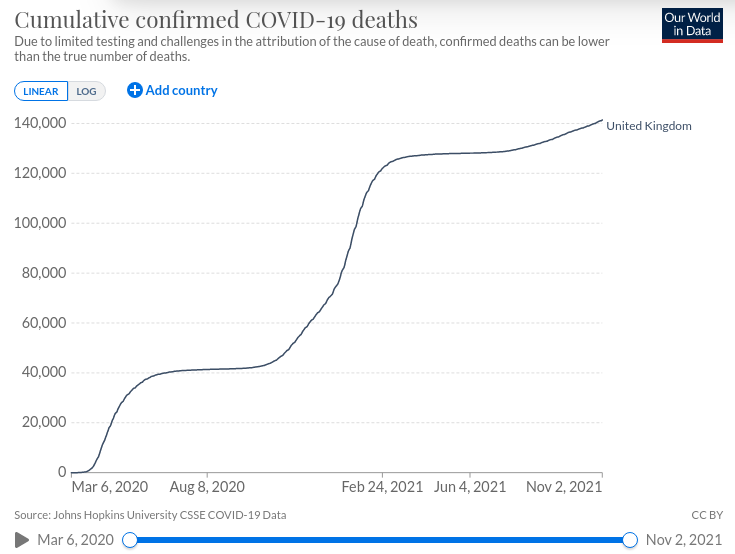
The World Health Organization confirmed that a new coronavirus was causing illnesses in Wuhan City, Hubei, China on 12 January 2020. Currently, the United Kingdom has authorized and begun the use of the Pfizer/BioNTech COVID-19 vaccine. Currently, the UK has the world’s eighth-highest death rate per hundred thousand population.
Origin and Spread of COVID-19 in the UK
Origin: The virus reached the UK in late January 2020. The BBC reported, in May 2020, that many members of a choir in Yorkshire showed symptoms of COVID-19 and that one of the members of the choir had returned from a business trip from Wuhan, China on 18 December.
However, in March 2020, reports stated that a 50-year-old man from East Sussex along with several members of his family, displayed COVID-19 symptoms on 20 January after he returned from Austria.
BBC reported in June 2020 that COVID-19 in the UK had at least 1356 origins, mostly from Italy, Spain and France. During the same month, it was reported that a 53-year-old woman fell ill on 6 January after returning from Austria. In August 2020, the Kent Coroner reportedly confirmed that the death of Peter Attwood, aged 84, on 30 January had been related to COVID-19, making him the first confirmed COVID-19 related death in the UK.
Confirmed Cases and Spread:
On 31 January the first confirmed cases were found in York. British nationals were evacuated from Wuhan to quarantine at Arrowe Park Hospital on the same day. A third confirmed case was reported in Brighton on 6 February in a man who returned from Singapore and France to the UK on 28 January. On 22 February, COVID-19 became a ‘notifiable disease’ in Scotland.
The Department of Health and Social Care (DHSC) confirmed 4 cases from the British-registered cruise ship Diamond Princess on 23 February. Around 25 cases were confirmed in a conference held in Edinburgh by Nike, Inc on 26-27 February. On 27 February the first confirmed cases were found from Northern Ireland. On 28 February the first confirmed case was found in Wales.
A British passenger aboard the Diamond Princess died from the virus on the same day. Closures and restrictions started in mid-March 2020. Lockdowns went on but started easing slightly during May. Autumn 2020 saw a resurgence in COVID-19 in the UK with exponential rises. Restrictions were further tightened and the alert level was increased from 3 to 4. The UK became the first country in the world to approve a COVID-19 vaccine on December 2 when it approved the Pfizer/BioNTech vaccine.
Immunization commenced on 8 December. The AZD 1222 and the MRNA-1273 vaccines were then approved on 30 December 2020 and 8 January 2021 respectively. As of 10 January, there have been more than 3 million confirmed cases and around 82000 deaths from COVID-19 in the UK.
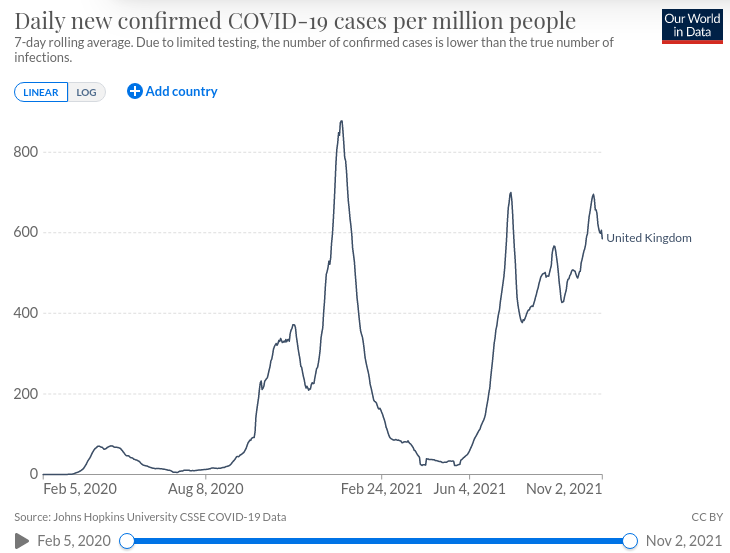
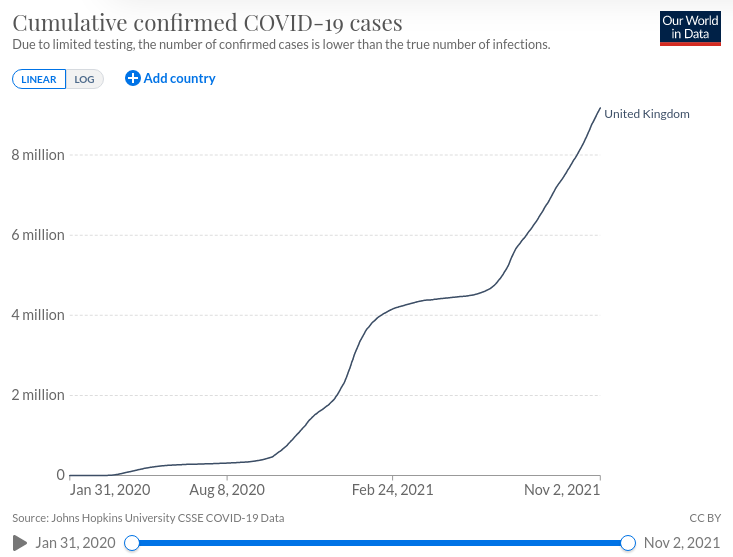
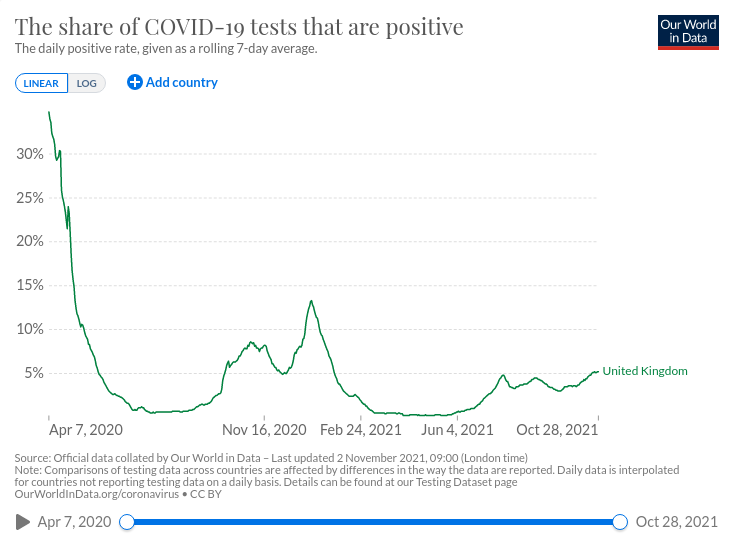
Getting An Idea Through Charts
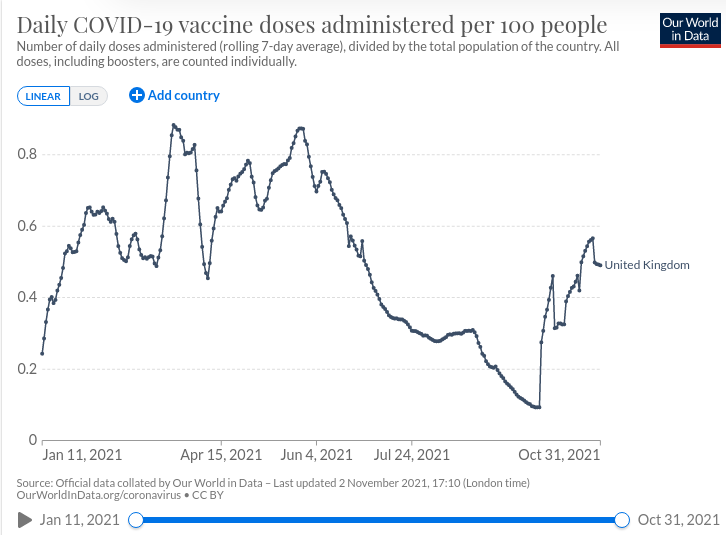
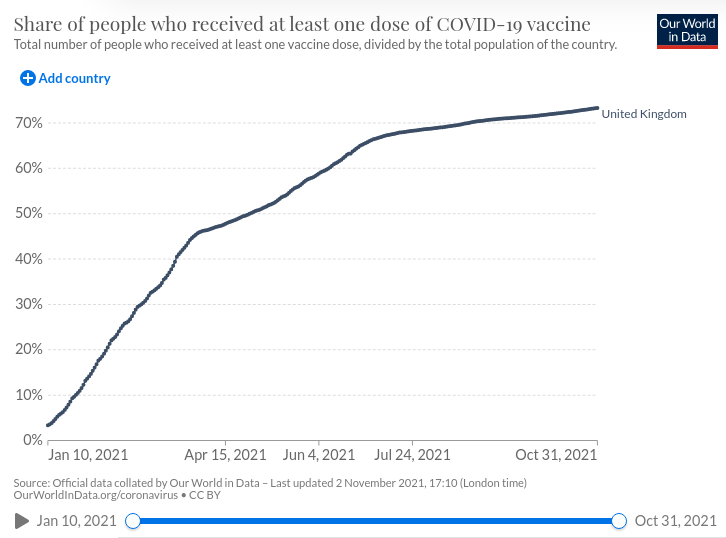
Vaccination
The UK started Vaccination on 8th December 2020. Currently, everyone of age 16 years and above are eligible to get a COVID 19 vaccination. As of 2/11/2021, 68.0% of the population is fully vaccinated against the virus.
These are the drugs that have been approved for use in the UK.
- BioNTech, Pfizer vaccine
- Johnson & Johnson vaccine
- Moderna vaccine
- Oxford, AstraZeneca vaccine
The following charts give an idea of the vaccination progress.
Conclusion
COVID-19 in the UK had a very high impact during April and May last year with positive rates going up to 30%. However, the impact was reduced as the above graphs show. Unfortunately, there has been an increase in confirmed cases and deaths during the past few months or so and according to the available data, the numbers will continue to climb. Therefore, based on the graphs and available data, the UK has controlled COVID-19 to some extent but a new potential wave seems to be incoming. However, due to the vaccination campaigns, the wave might get handled successfully.
Resources
https://ourworldindata.org/local-covid-uk
https://www.journalofinfection.com/article/S0163-4453(20)30102-X/pdf
https://coronavirus.data.gov.uk/
https://pandemic.internationalsos.com/2019-ncov/covid-19-data-visualisation
https://coronavirus.jhu.edu/data/mortality
https://www.nrscotland.gov.uk/covid19stats
http://news.bbc.co.uk/2/hi/health/7149423.stm
https://www.bbc.com/news/uk-55227325
http://news.bbc.co.uk/2/hi/health/7586147.stm
https://www.bbc.com/news/uk-54908680
https://www.gov.uk/guidance/local-restriction-tiers-what-you-need-to-know
https://www.bmj.com/content/371/bmj.m4857
https://www.thetimes.co.uk/article/v-day-brings-covid-vaccine-to-first-british-patients-fktm0cbml
https://www.bbc.com/news/business-52660591
https://www.ft.com/content/c26434a2-5337-45e9-a94b-2c33fd55306a
https://www.bbc.com/news/uk-54905018
https://www.telegraph.co.uk/politics/2020/03/25/coronavirus-bill-summary/
https://www.bbc.com/news/health-55308211
The rest of the report will be published soon! There will be two more parts